The Ground Game (10.17.20)
A Primer
It’s getting clearer each week that I should be building a probabilistic model with accurate state-level predictions. On a non-midterm week, that is what I would be doing here. But, as with many things, life got in the way, so instead this week I will be examining turnout trends. I had three questions:
(1) How high is turnout generally? (Consistently decent.)
(2) Does this differ by election type? (Yes.)
(3) Are there any regional trends? (North > South.)
(4) What does this tell us for 2020? (It’s complicated.)
Turnout
The right to vote is important for a healthy democracy, but it does not guarantee that everyone votes. Americans care very much about having the option to vote, even if not all of them partake in the electoral process. Other countries do this differently; in Australia, for example, citizens can be fined for not voting.
There has also been recent emphasis on American non-voters. Most notably in 2016, campaigns have made large efforts to encourage these populations to vote for their candidate. As a result, there is a general sentiment that “outsider” candidates can best marshal non-voters in their favor. Presumably, non-voters don’t vote because they are fed up with the system, so an outsider could renew their faith in the process by promising change.
A simple question arises: was 2016 all that different in voter turnout? I decided to graph voter turnout in presidential election years and midterm elections over time:
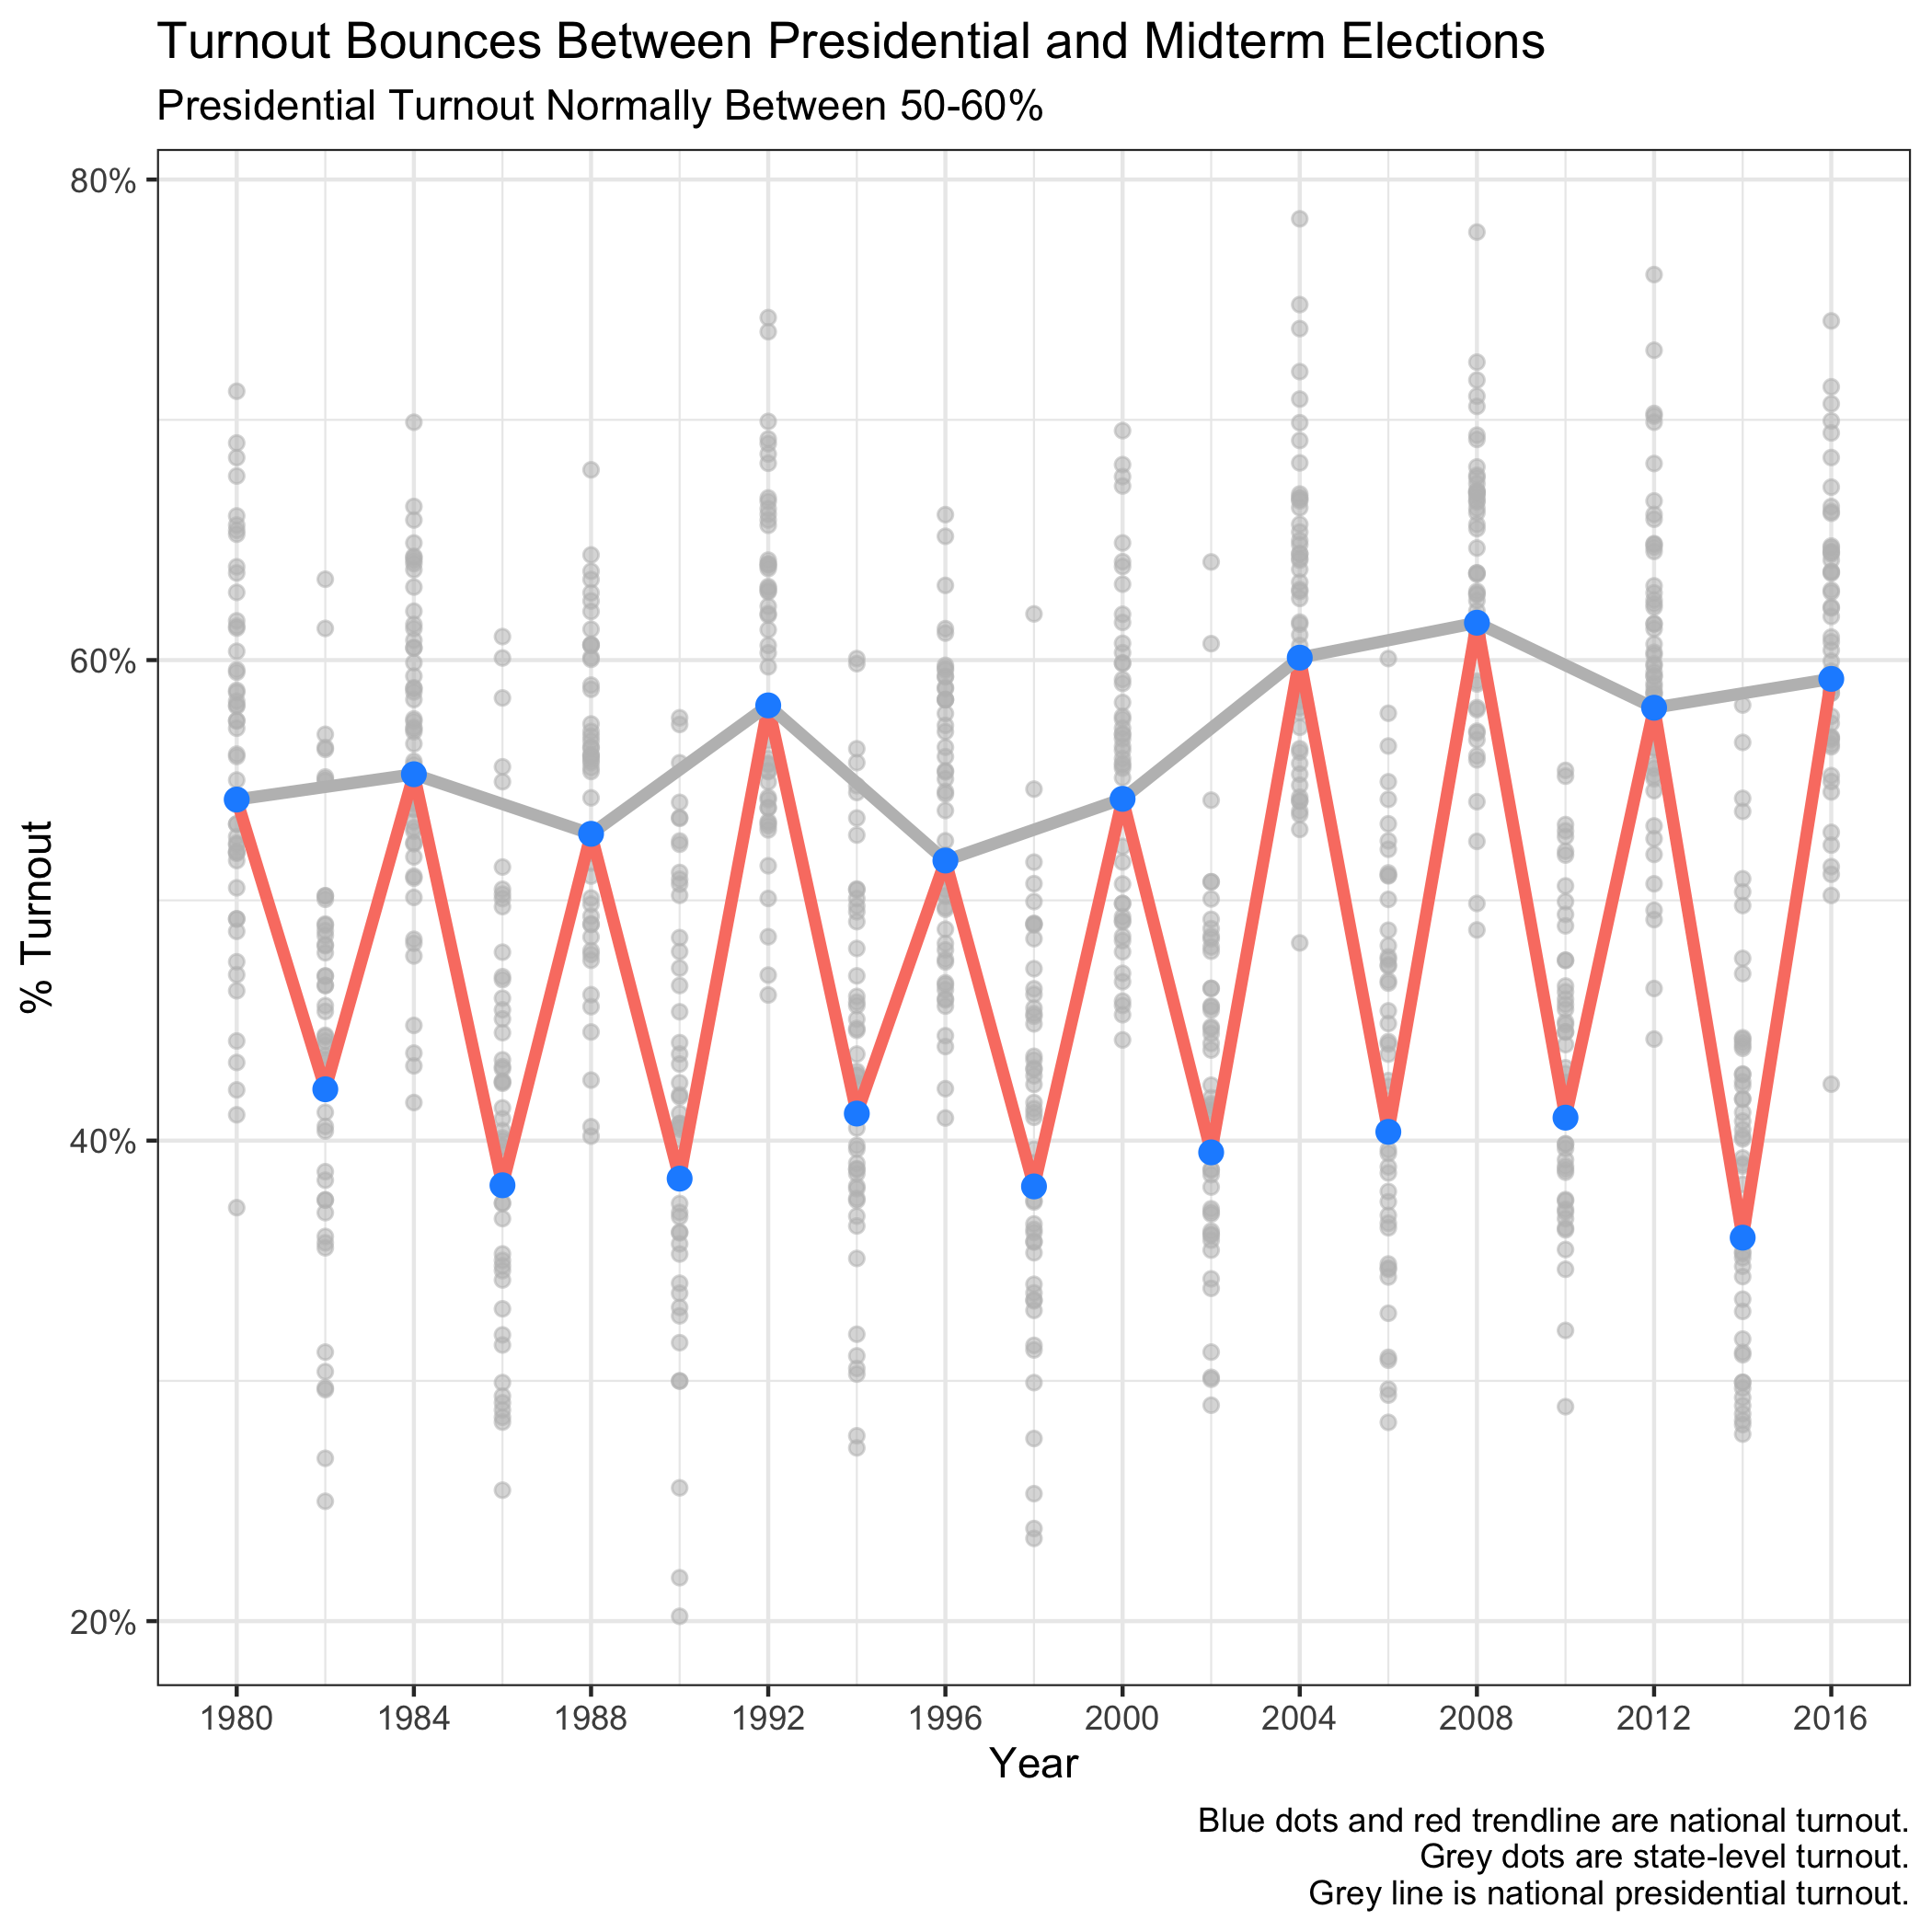
There are three takeaways:
(1) 2016 turnout wasn’t particularly high at 59.2%, although it was higher than in 2012 (58%). Overall, though, only half to two-thirds of the voting eligible population votes in presidential election years. This is low!
(2) Turnout dramatically dips in midterm elections. Even though every house seat is up every 2 years, the lack of a presidential race probably lowers the implied importance of voting for most people.
(3) The grey dots are all state-level turnouts, and there seems to be massive variation in both types of elections (presidential and midterm).
That last takeaway merits a closer look. I took state-level data and plotted turnout using geofacet:
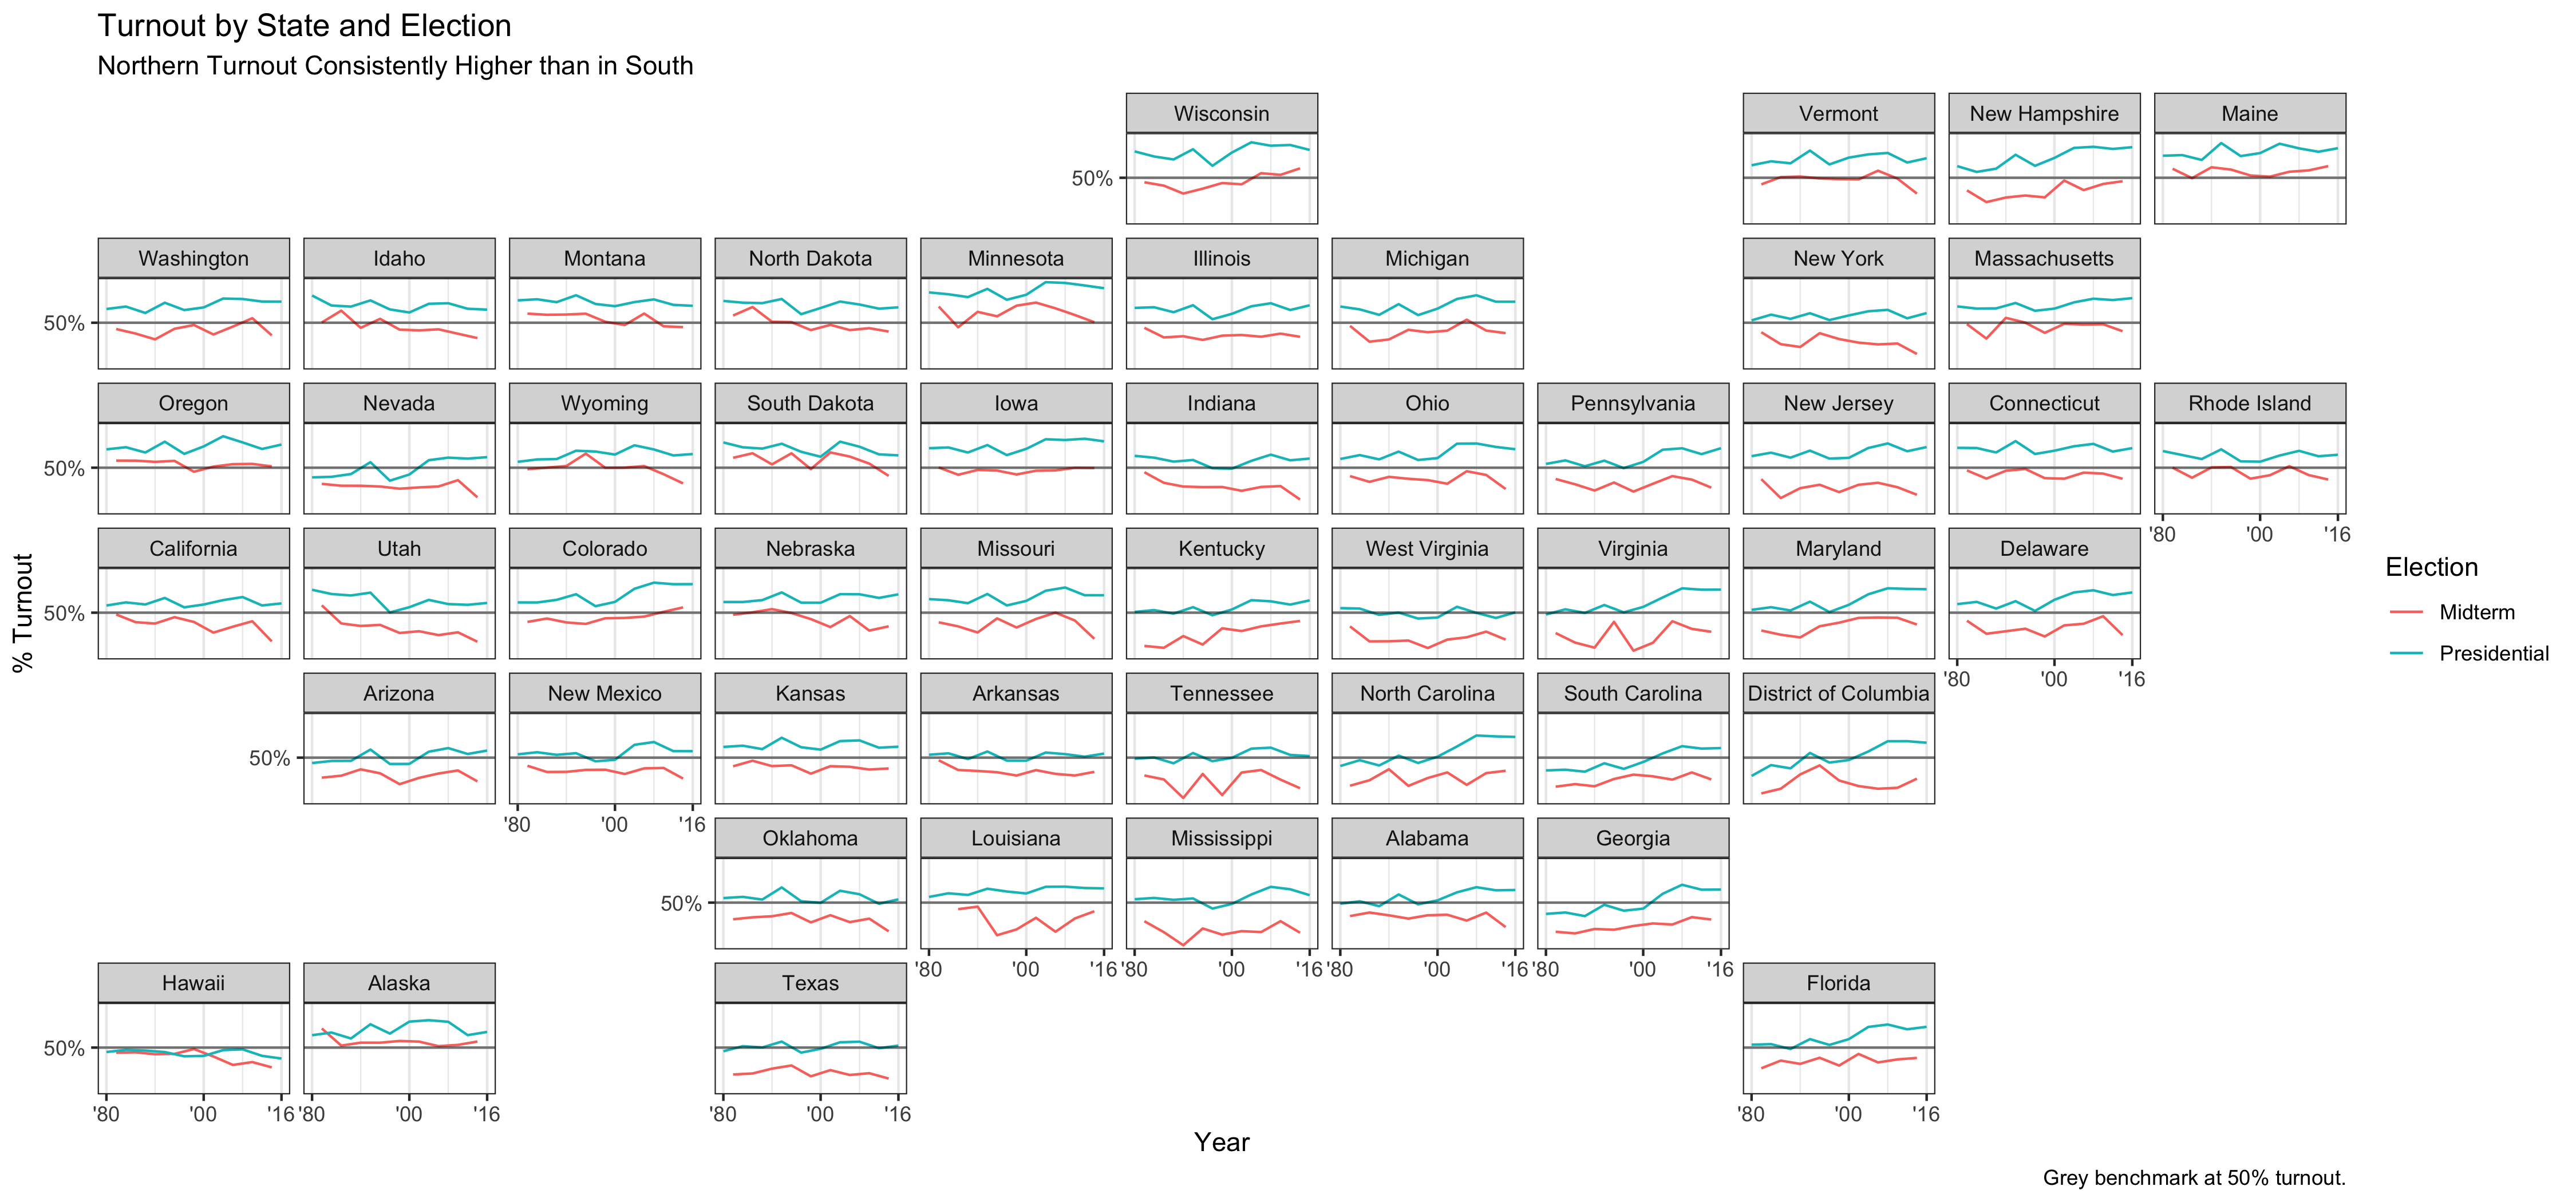
(1) As a whole, turnout in northern states seems to dwarf turnout in southern states in presidential elections. Turnout is dismal in midterms throughout, but still seems to be higher in the North. I will explore this more below.
(2) Midterm turnout lags behind presidential turnout pretty consistently. Still, in some small states like Hawaii, Idaho, and South Dakota, midterm turnout approaches presidential levels. Could this be the result of statewide house districts having more importance than districts in larger states?
(3) Some perennial battleground states (Florida, Ohio, etc.) have high turnout. Is this due to campaign effort, as described in Enos and Fowler (2016)? Or could there be a separate explanation?
What does turnout look like regionally? I used the four major census regions (Northeast, Midwest, South, and West) and created regional turnout metrics in election years. I compared these to national turnout in the visualization below:
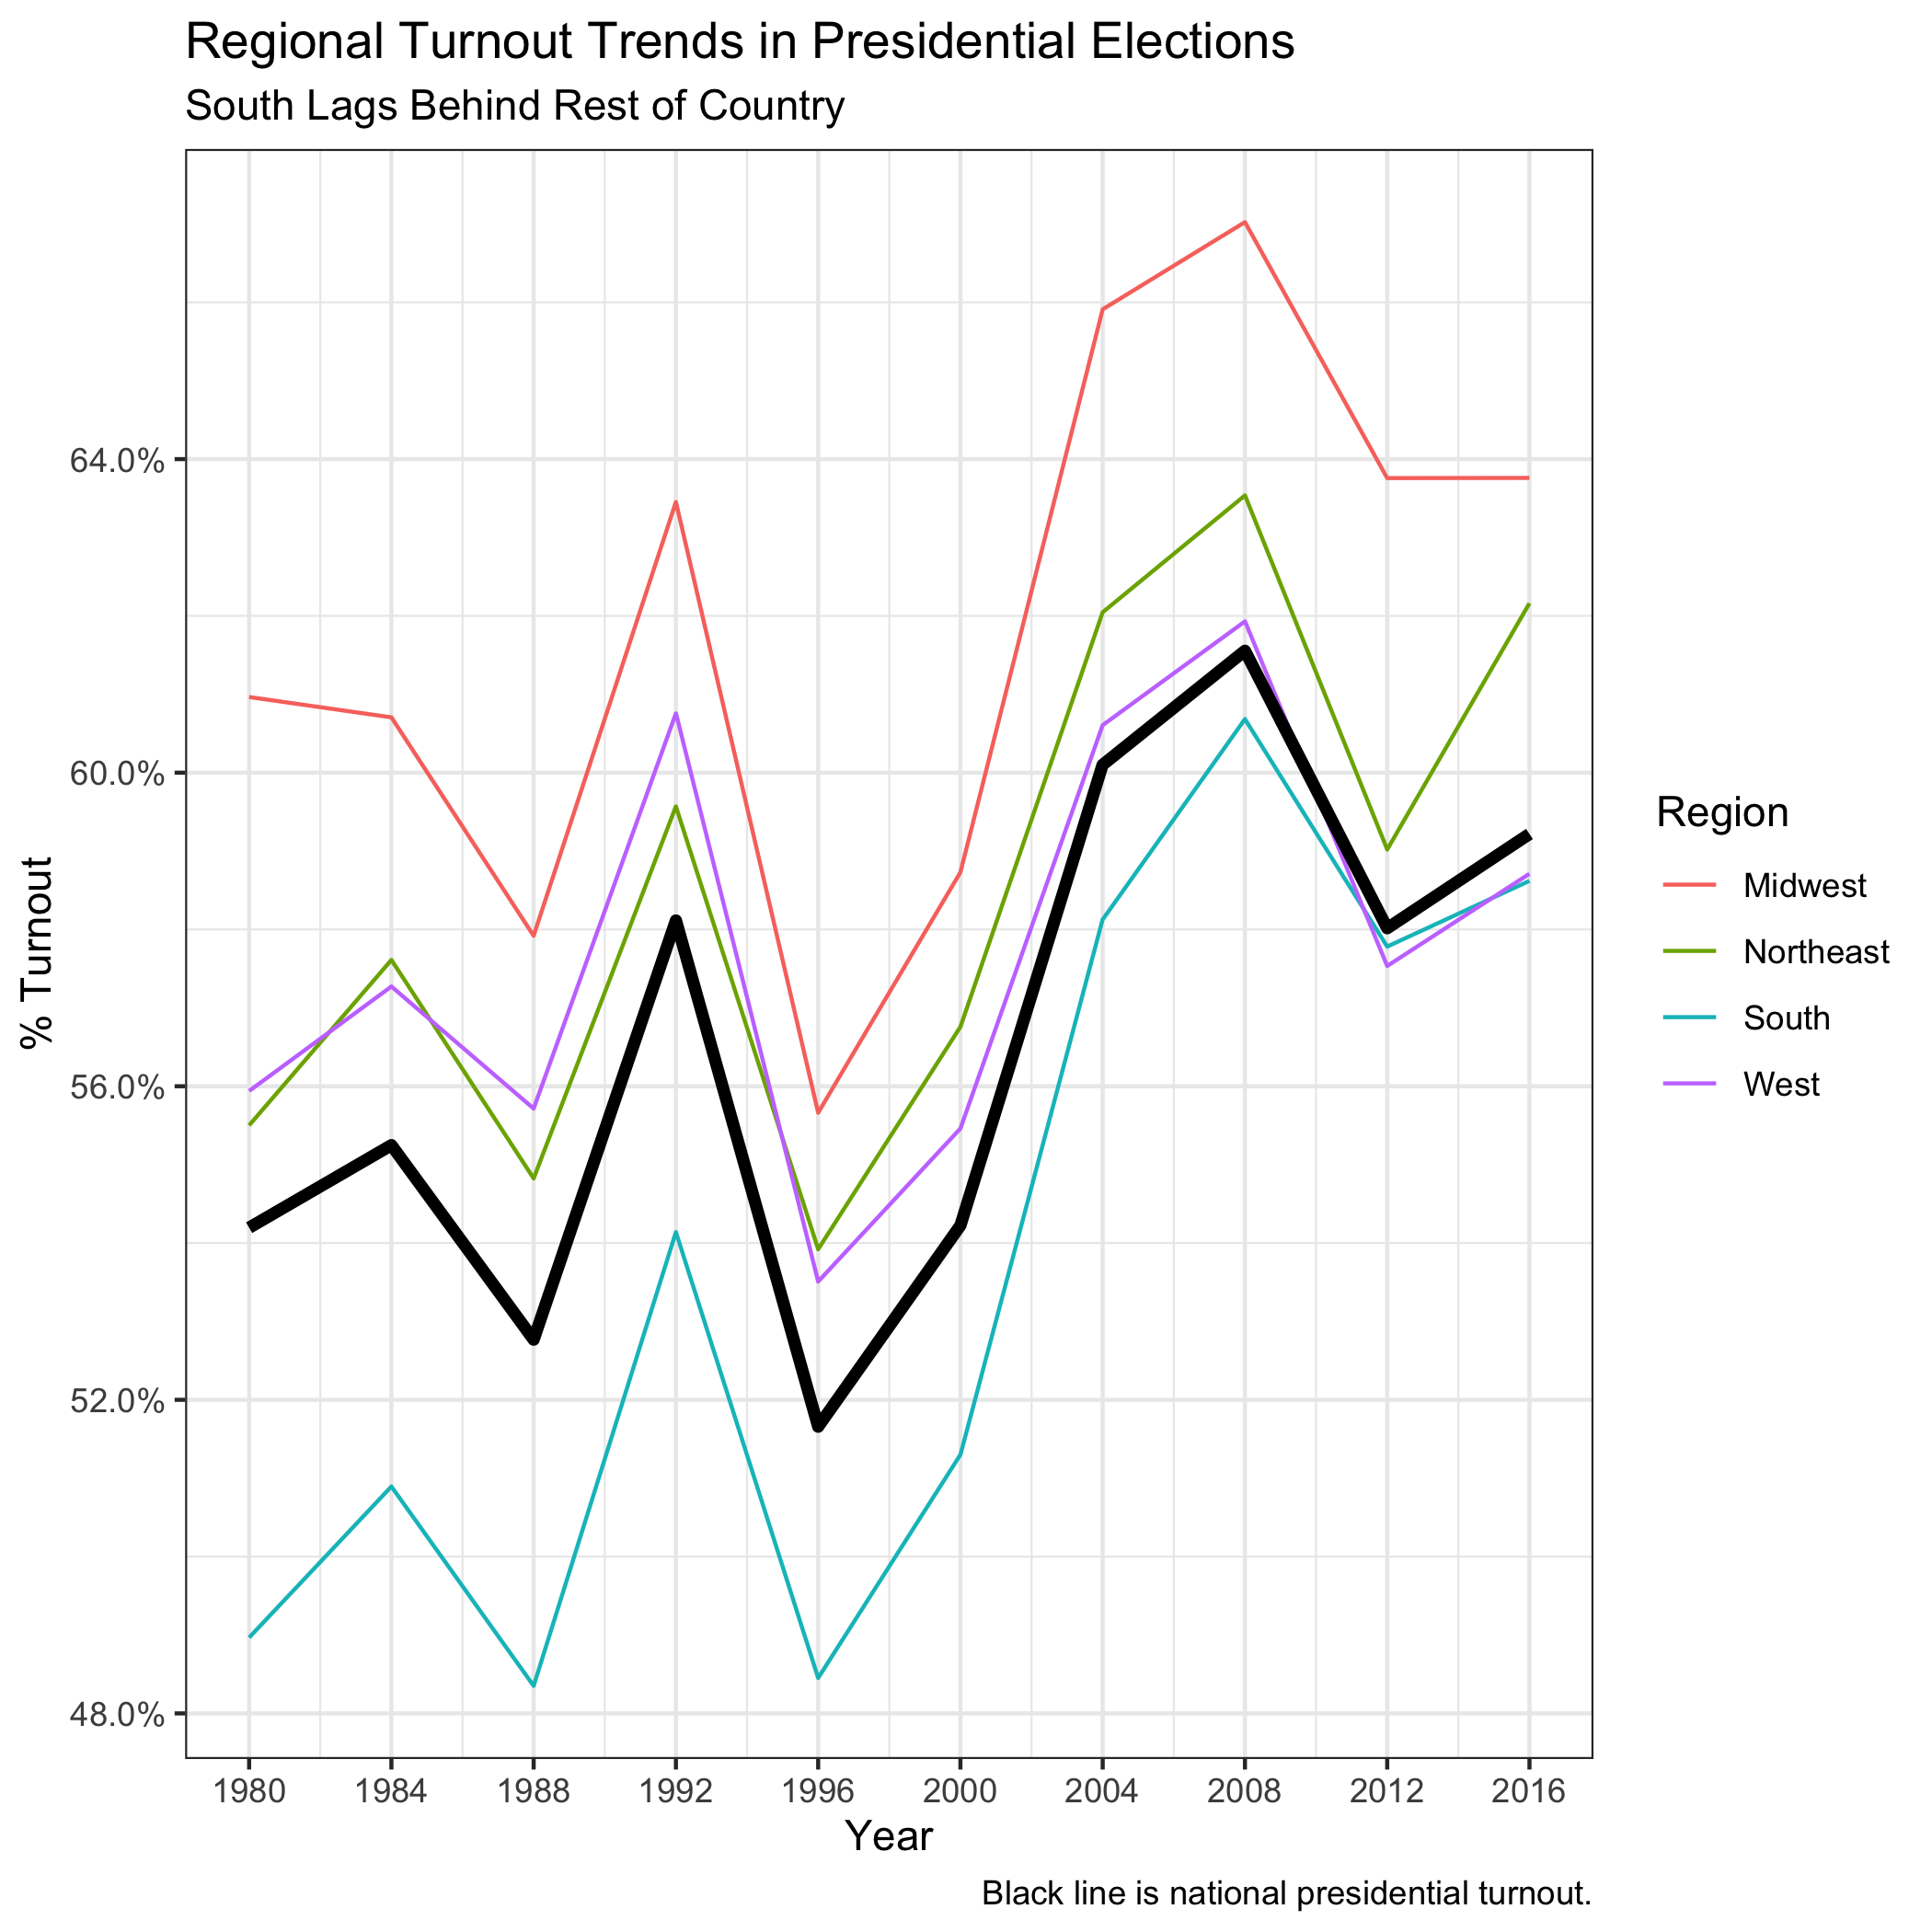
A few conclusions:
(1) Turnout is indeed higher in the north (Northeast and Midwest) than in the South. There could be a variety of explanations here, including fewer competitive elections and more hurdles to voting.
(2) The West has historically outperformed the national average, but this has recently fallen.
An open question is whether there are any year-specific regional boosts. I lagged each state’s turnout, computed summary statistics by region, and plotted the results:
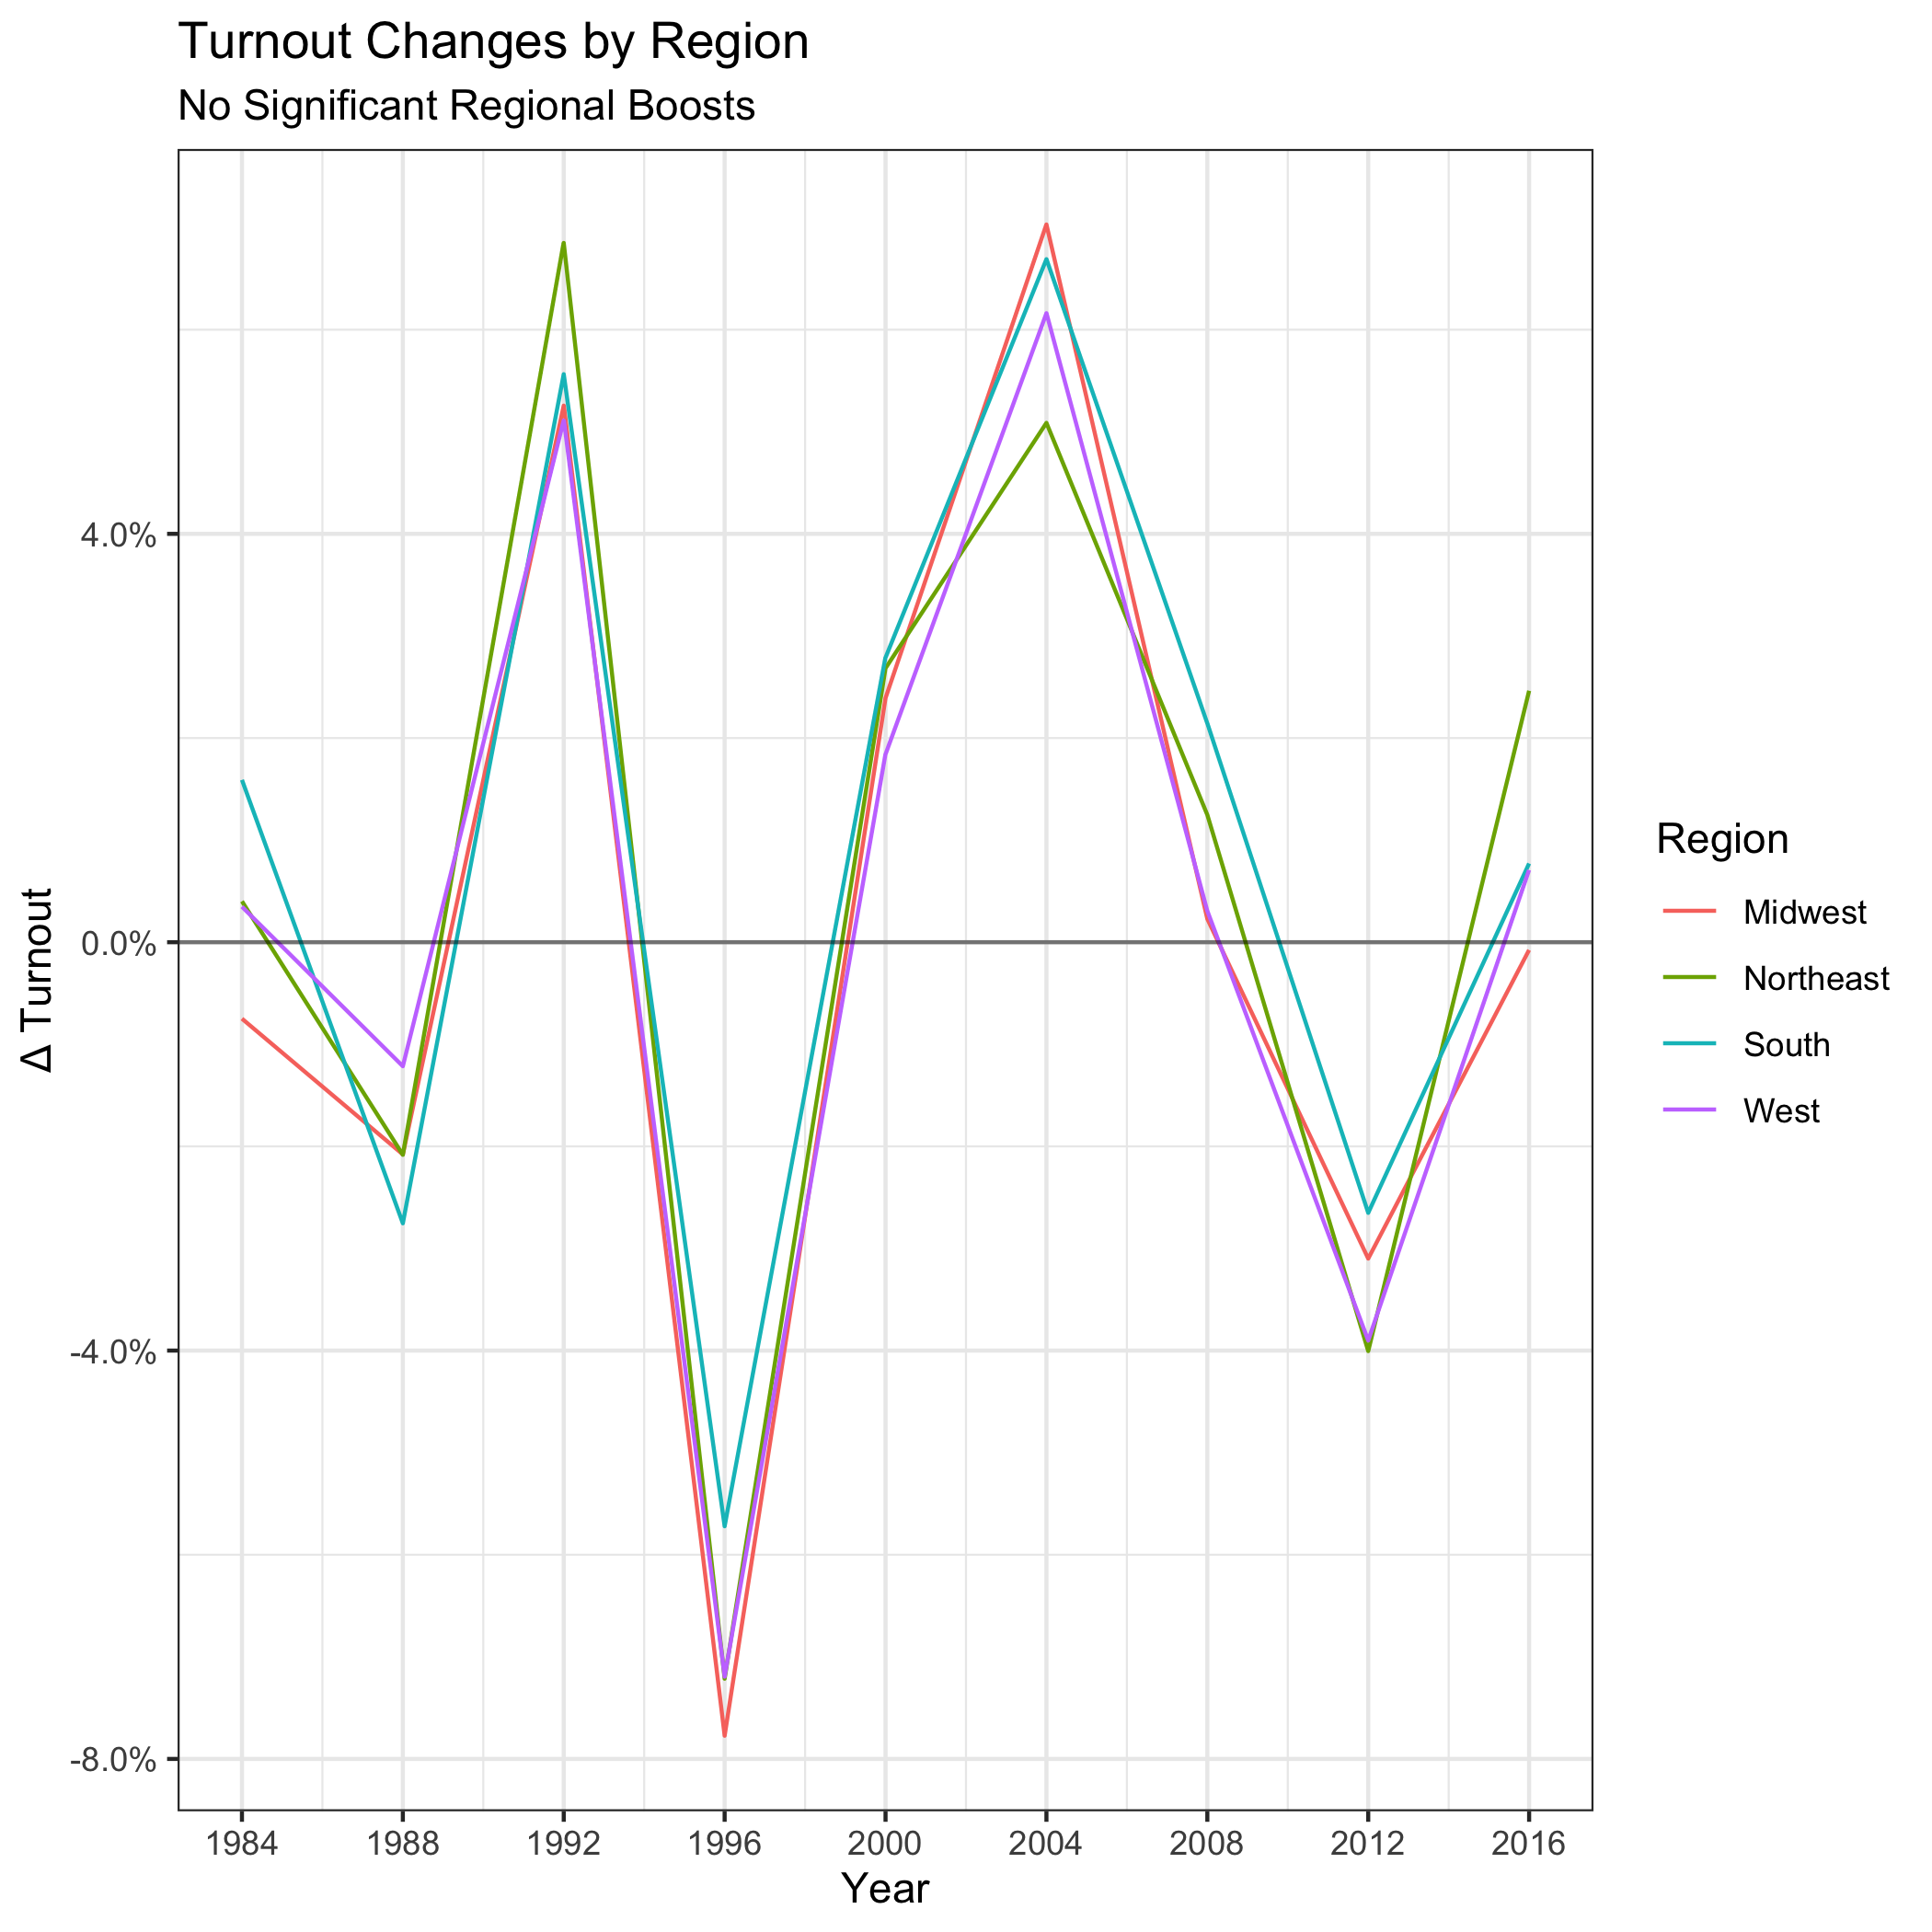
Overall, there don’t seem to be any region-specific effects in certain elections. Any differences seem to be pretty minor. The only trend seems to be lower turnout in re-election campaigns, but 2004 bucks that trend pretty significantly.
Impact on 2020
These trends are a good baseline for any 2020 prediction, but this will be a drastically different election due to the pandemic. Many states are increasing their reliance on vote-by-mail and discouraging in-person voting. This will dramatically change the structure of Election Day, with the potential for results to be unknown until the end of the week (or longer).
There are two major models to watch this cycle: FiveThirtyEight and The Economist. In general, FiveThirtyEight deemphasizes fundamentals in favor of accuracy-adjusted polling metrics. The Economist, on the other hand, leans more into “fundamentals,” but adjusts accordingly for the massive swings in economic indicators during the pandemic. Where FiveThirtyEight’s model can at times be a black box, The Economist’s model is mostly open-source.
Turnout in both models appears to be sampled from a prior distribution based on past turnout and other variables. FiveThirtyEight has gone a step further than The Economist in pandemic-specific turnout by widening these distributions, increasing uncertainty and error. They also claim to have gone a step further by accounting for ease of voting. The Economist may have had a relatively wide distribution of potential turnouts when constructing their models, but they are upfront (as of early June) about not incorporating the pandemic’s impact on turnout into their forecast.
Which one of these methods will work the most accurately? For turnout alone, I’d go with FiveThirtyEight, if only because they are adjusting their forecast to try and capture the pandemic’s impact. As the US Elections Project notes, voters have already cast 18.8% of the total votes from the 2016 election (over 26 million ballots!), which points to potentially even higher turnout than Trump v. Clinton. However, it’s important not to read too much into this number - there’s no hard evidence that these votes are coming from new voters. Another caveat is that even if FiveThirtyEight’s model more accurately predicts turnout than The Economist, the latter still has a chance to better forecast the overall results. One final note is that the Economist may have updated their model to include turnout adjustments, but it isn’t noted on the model’s homepage or earlier articles.
References
The Economist. (2020). “Forecasting the US elections.” Updated October 17, 2020. Accessed online.
Enos, R. and Fowler, A. (2016). “Aggregate effects of large-scale campaigns on voter turnout.” Political Science Research and Methods 6(4). October 2016. Accessed online.
McDonald, M. (2020). “2020 general election early vote statistics.” United States Elections Project. Updated October 17, 2020. Accessed online.
Silver, N. (2020, August 12). “How FiveThirtyEight’s 2020 presidential forecast works — And what’s different because of COVID-19.” FiveThirtyEight. Accessed online.